Vignette#
Exemplary analysis of the PBMC3K single-cell RNA dataset.
[1]:
%%capture --no-display
%pip install scanpy
[2]:
import os
import math
import warnings
import matplotlib.pyplot as plt
import pandas as pd
import scanpy as sc
from keggtools import (
    Pathway,
    Enrichment,
    EnrichmentResult,
    Resolver,
    Renderer,
    IMMUNE_SYSTEM_PATHWAYS,
    plot_enrichment_result,
)
from IPython.display import Image, display

# Used folders
figure_dir = os.path.join(os.getcwd(), "figures")

# Global settings
sc.settings.verbosity = 0
sc.logging.print_header()
sc.settings.set_figure_params(dpi=80, facecolor="white")

# Ignore all warnings
warnings.filterwarnings("ignore", category=UserWarning)
Load preprocessed PMBC3K dataset#
[3]:
adata = sc.datasets.pbmc3k_processed()
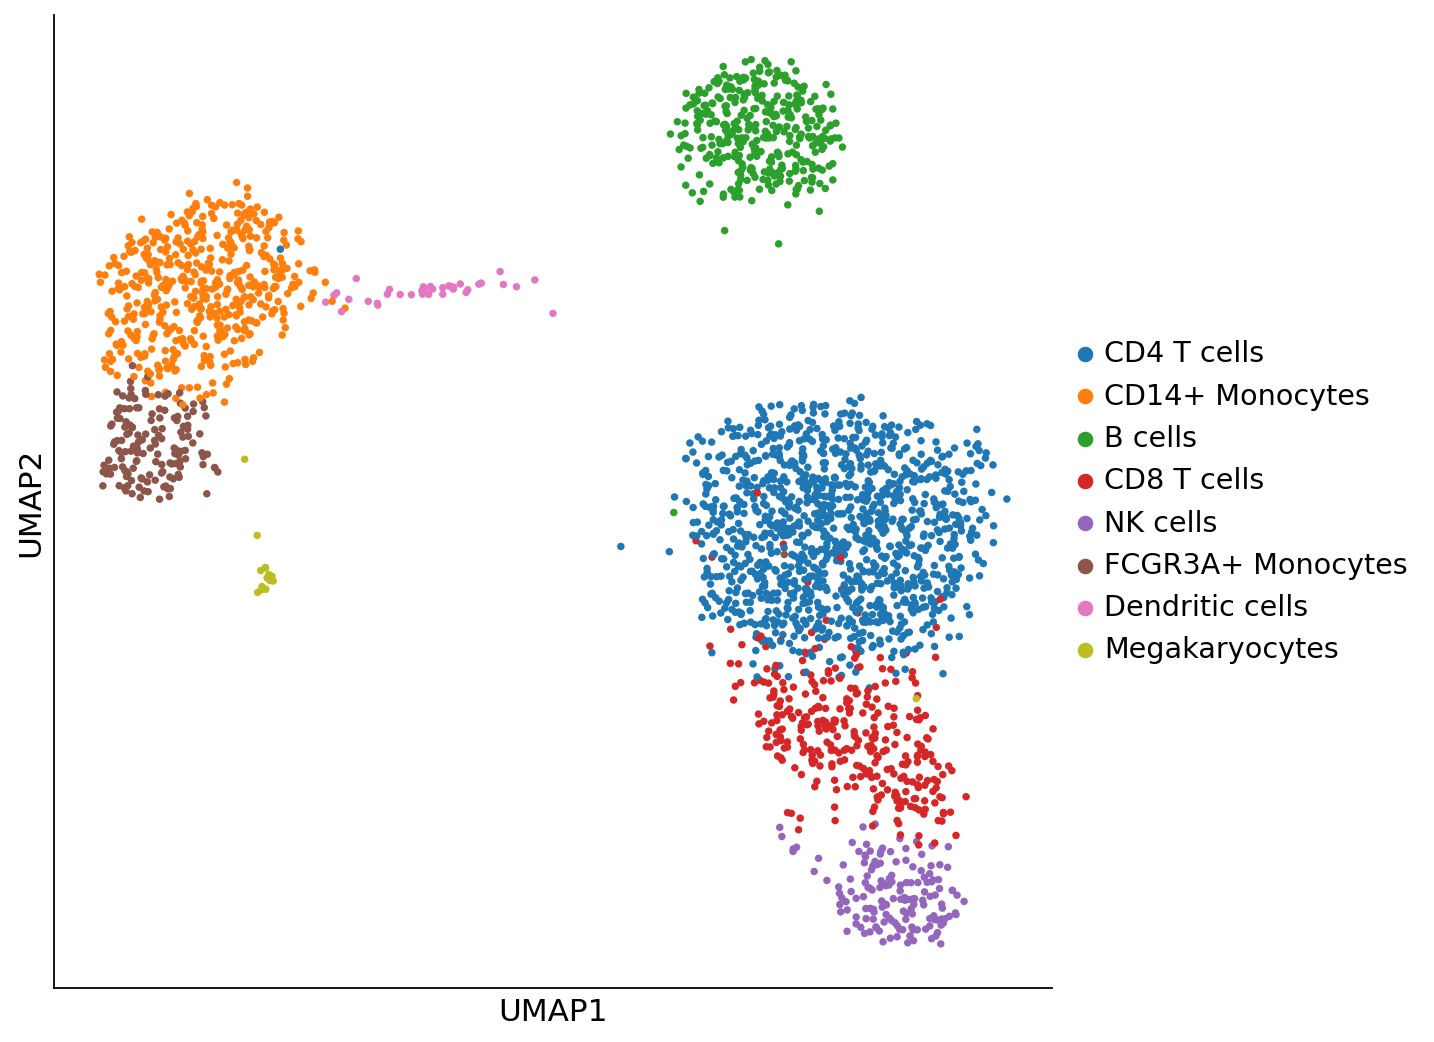
Plot UMAP with cluster annotations#
[4]:
fig, ax = plt.subplots(1, 1, figsize=(8, 8))
sc.pl.umap(adata, color="louvain", legend_loc="right margin", title="", frameon=True, ax=ax, show=False)
ax.spines["top"].set_visible(False)
ax.spines["right"].set_visible(False)
fig.savefig(os.path.join(figure_dir, "figure2.png"))
Differential analysis results to pandas dataframe#
[5]:
sc.tl.rank_genes_groups(adata, "louvain", method="wilcoxon", n_genes=100)
[6]:
# Export diff exp data
diffexp_df = sc.get.rank_genes_groups_df(adata, group="NK cells", pval_cutoff=0.05)
diffexp_df.head()
[6]:
| names | scores | logfoldchanges | pvals | pvals_adj | |
|---|---|---|---|---|---|
| 0 | NKG7 | 20.181747 | 5.623642 | 1.416465e-90 | 1.942540e-86 |
| 1 | GZMB | 19.738880 | 6.650631 | 9.996947e-87 | 6.854906e-83 |
| 2 | PRF1 | 19.434803 | 5.433477 | 3.919145e-84 | 1.791572e-80 |
| 3 | GNLY | 19.357994 | 6.657686 | 1.745530e-83 | 5.984549e-80 |
| 4 | CTSW | 18.578722 | 3.808060 | 4.777493e-77 | 1.310371e-73 |
Perform KEGGTOOLS enrichment analysis#
[7]:
organism_id: str = "hsa"
[8]:
from keggtools.utils import merge_entrez_geneid
[9]:
diffexp_df = merge_entrez_geneid(diffexp_df)
diffexp_df.head()
[9]:
| names | scores | logfoldchanges | pvals | pvals_adj | symbol | entrez | |
|---|---|---|---|---|---|---|---|
| 0 | NKG7 | 20.181747 | 5.623642 | 1.416465e-90 | 1.942540e-86 | NKG7 | 4818 |
| 1 | GZMB | 19.738880 | 6.650631 | 9.996947e-87 | 6.854906e-83 | GZMB | 3002 |
| 2 | PRF1 | 19.434803 | 5.433477 | 3.919145e-84 | 1.791572e-80 | PRF1 | 5551 |
| 3 | GNLY | 19.357994 | 6.657686 | 1.745530e-83 | 5.984549e-80 | GNLY | 10578 |
| 4 | CTSW | 18.578722 | 3.808060 | 4.777493e-77 | 1.310371e-73 | CTSW | 1521 |
[10]:
# Init resolver instance
resolver: Resolver = Resolver()
pathway_list: list[Pathway] = []

# Download all immune system pathways
for number, _ in IMMUNE_SYSTEM_PATHWAYS.items():
    pathway_list.append(resolver.get_pathway(organism=organism_id, code=number))
[11]:
# Init enrichment from list of immune system pathways
analysis: Enrichment = Enrichment(pathways=pathway_list)
analysis_result: list[EnrichmentResult] = analysis.run_analysis(gene_list=list(diffexp_df["entrez"]))
result_df: pd.DataFrame = analysis.to_dataframe()

# Filter out pathways with no genes found
result_df = result_df[result_df["study_count"] > 0]

# Print out result
result_df.sort_values(by="pvalue", ascending=True).head()
[11]:
| pathway_name | pathway_title | pathway_id | study_count | pathway_genes | pvalue | found_genes | |
|---|---|---|---|---|---|---|---|
| 8 | path:hsa04650 | Natural killer cell mediated cytotoxicity | 04650 | 17 | 134 | 0.000071 | 5551,3133,7535,117157,10870,919,2207,7305,3002... |
| 4 | path:hsa04621 | NOD-like receptor signaling pathway | 04621 | 3 | 189 | 0.042361 | 6352,10628,1535 |
| 0 | path:hsa04640 | Hematopoietic cell lineage | 04640 | 1 | 100 | 0.085921 | 924 |
| 9 | path:hsa04612 | Antigen processing and presentation | 04612 | 7 | 81 | 0.094117 | 567,3105,3106,3107,3133,3824,2923 |
| 10 | path:hsa04660 | T cell receptor signaling pathway | 04660 | 2 | 122 | 0.173754 | 7535,919 |
Plot results of enrichment analysis#
[12]:
fig, ax = plt.subplots(figsize=(7, 7))
plot_enrichment_result(analysis, ax=ax)
fig.savefig(os.path.join(figure_dir, "figure4.png"), bbox_inches="tight")
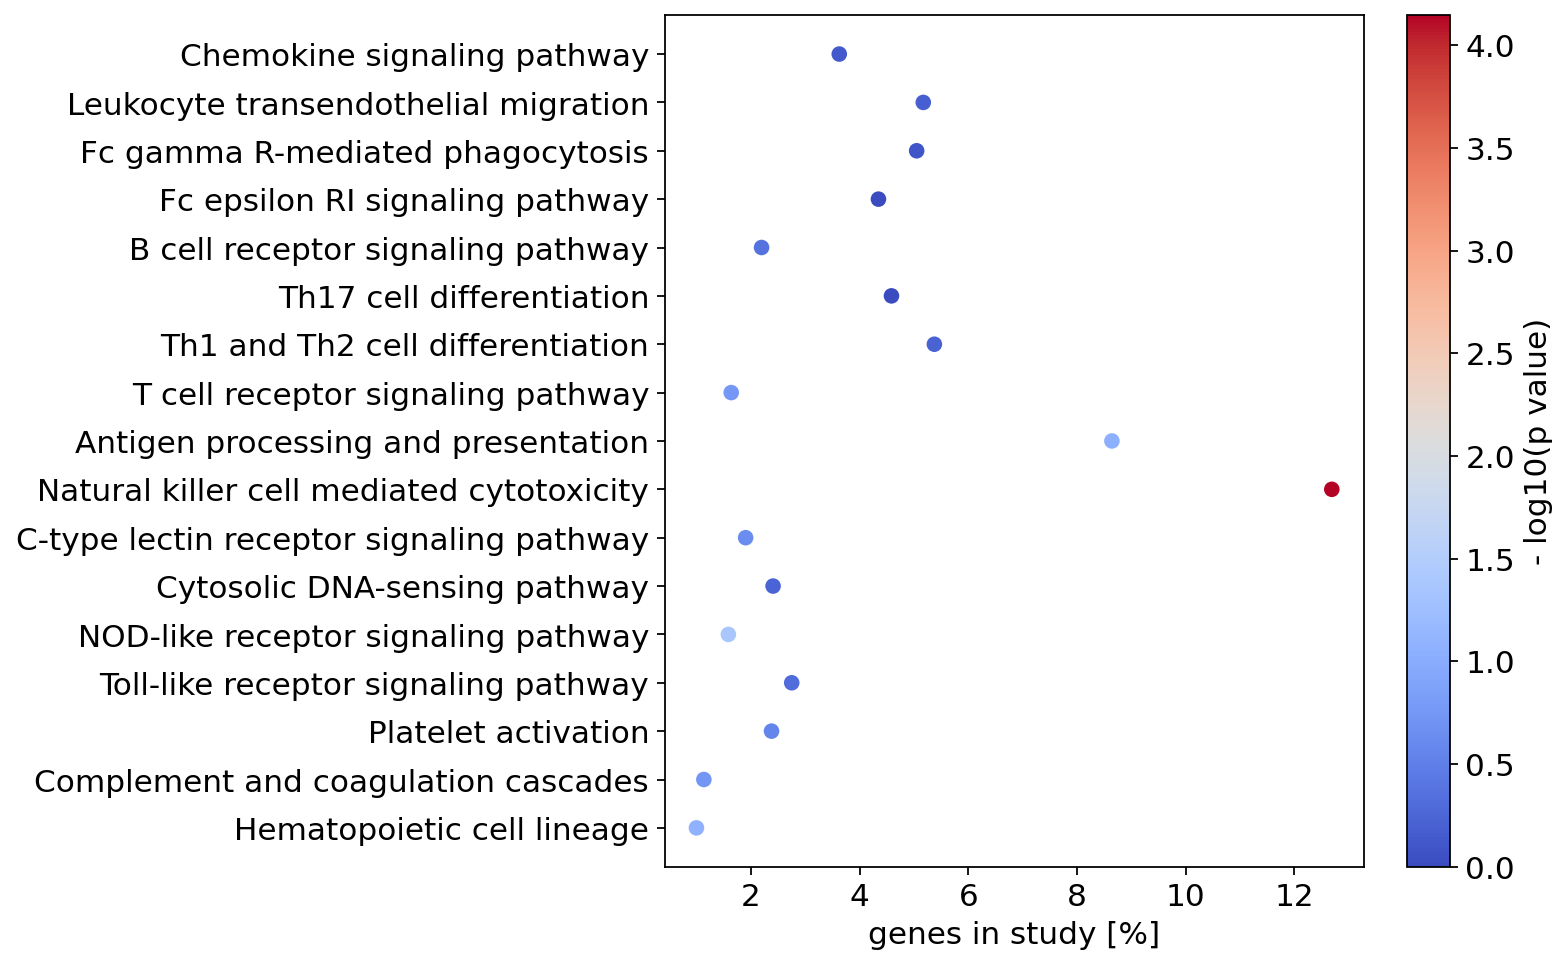
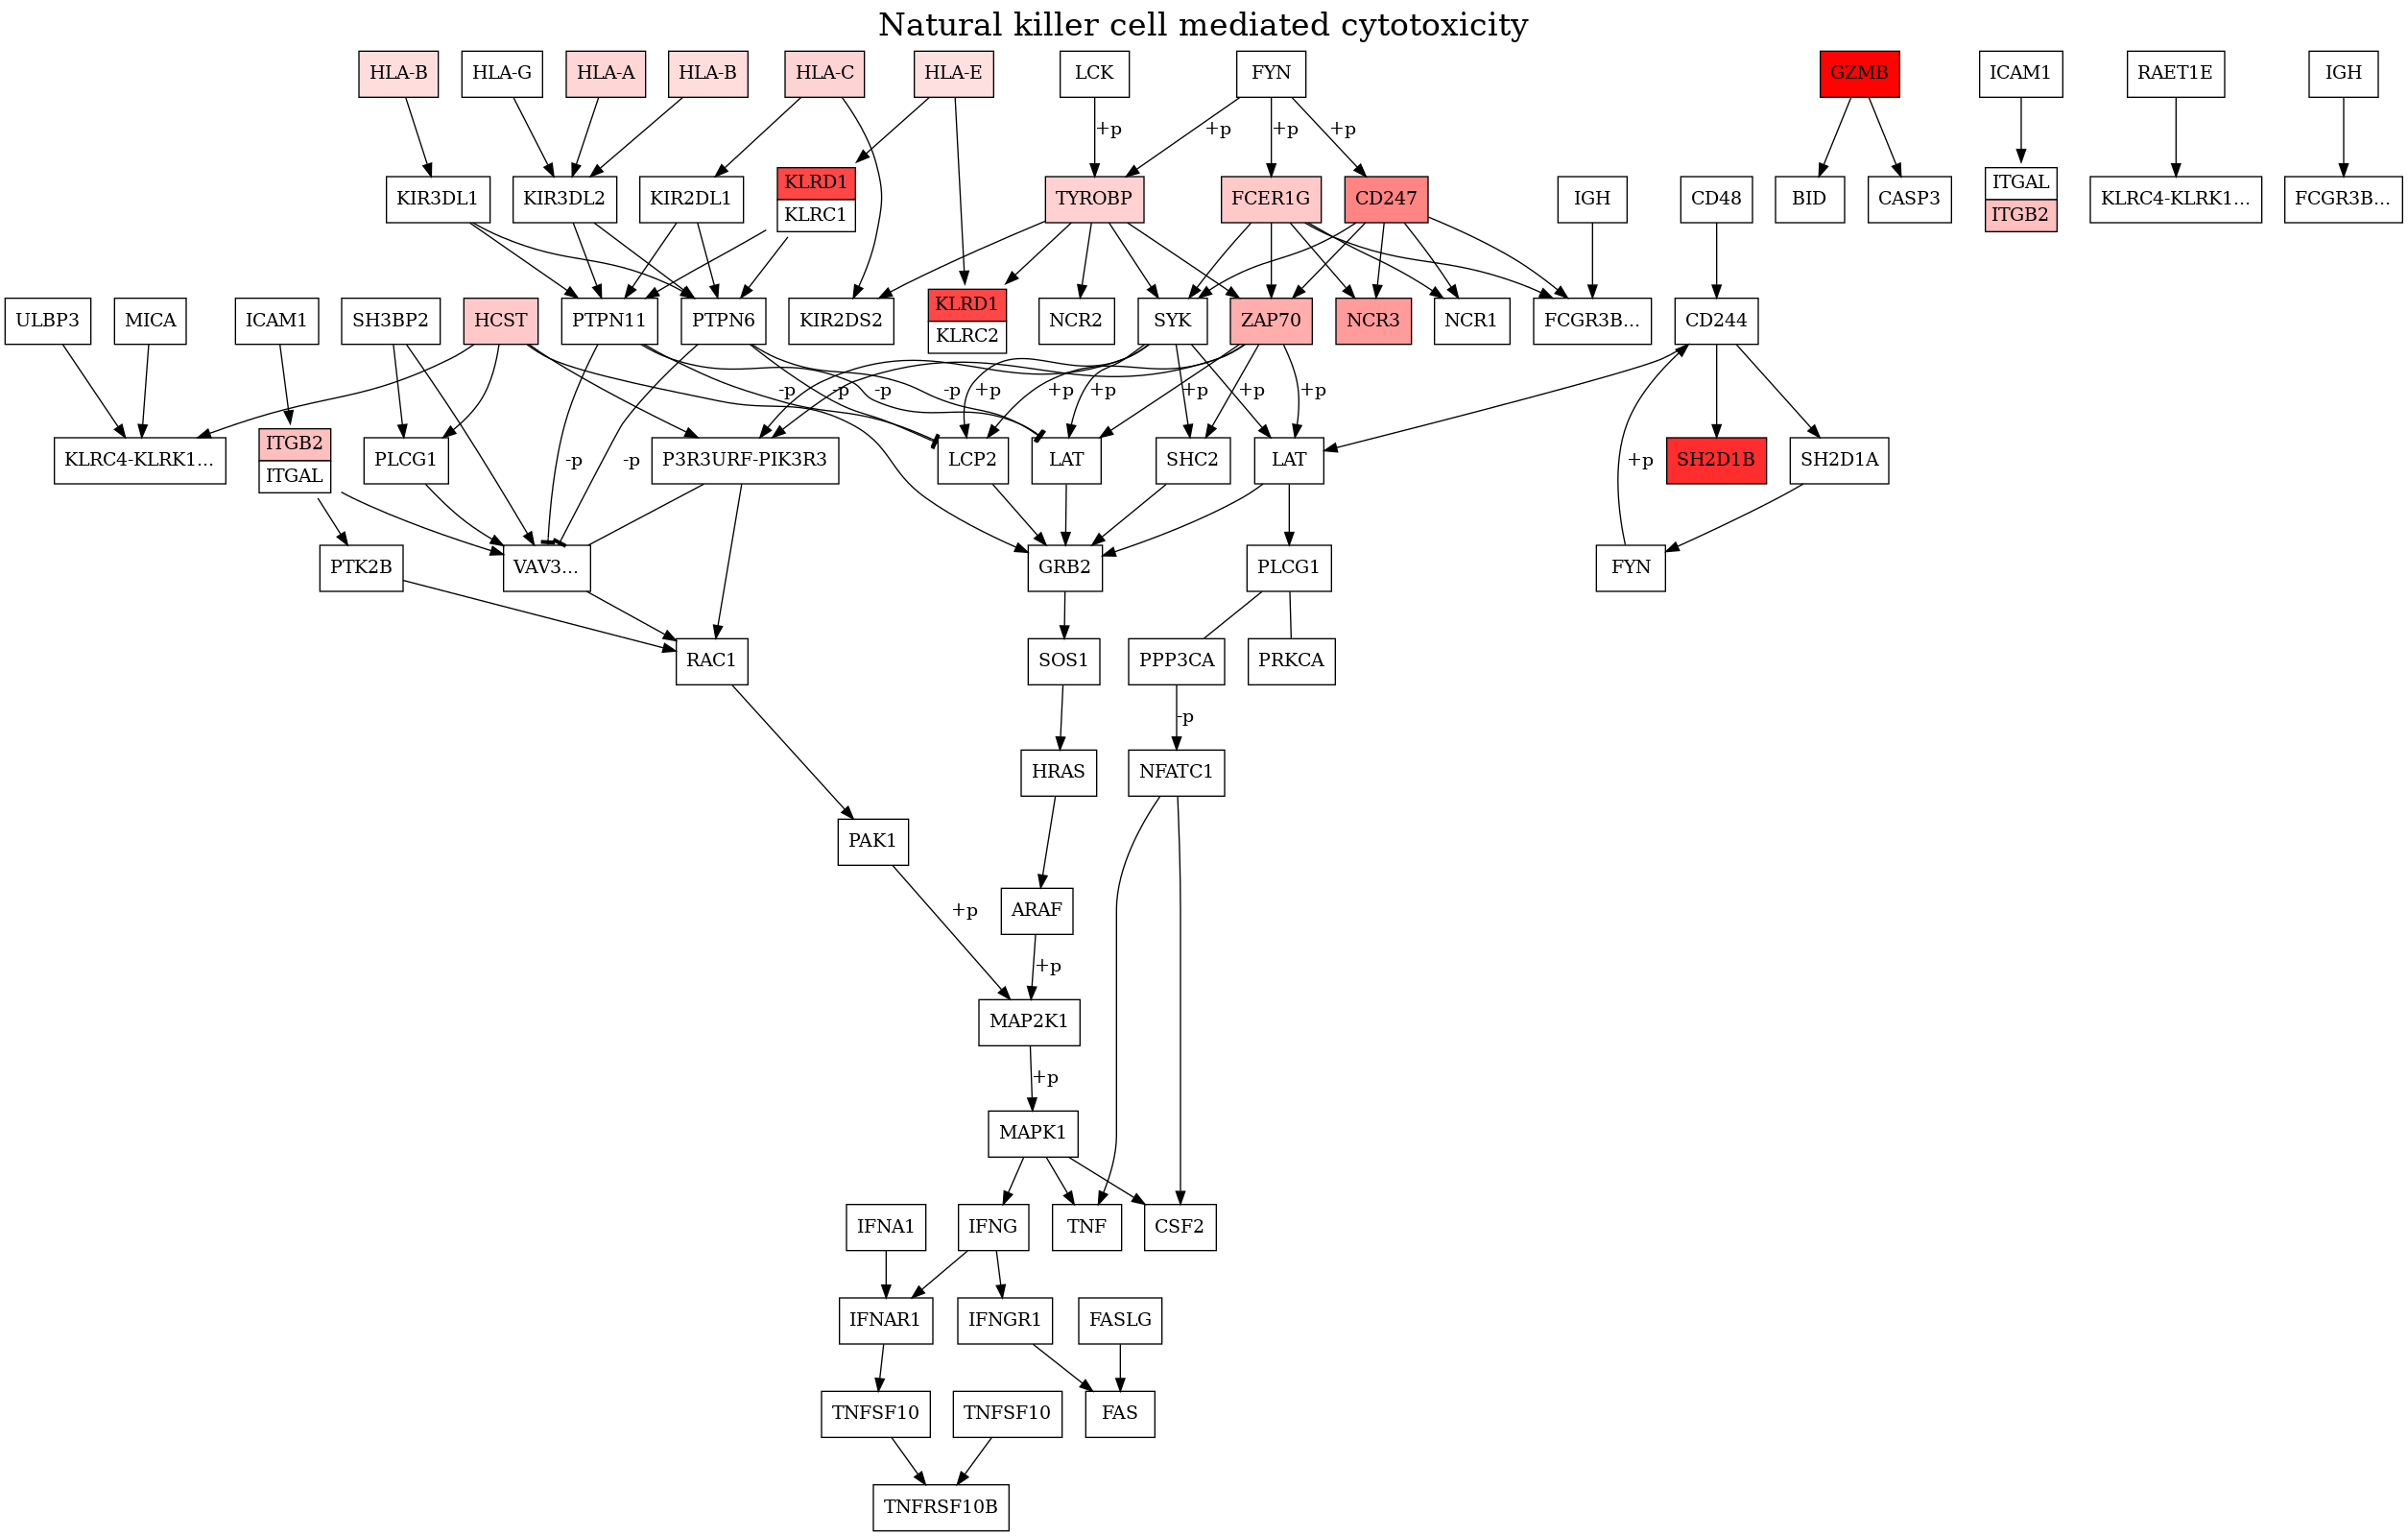
Plot pathway#
“Antigen processing and presentation” (hsa:04612) show a significant p value
[13]:
pathway: Pathway = resolver.get_pathway(organism=organism_id, code="04650")
[14]:
# diffexp_df[["entrez"]] = diffexp_df[["entrez"]].astype(int)
overlay: dict = dict(zip(list(diffexp_df["entrez"]), list(diffexp_df["logfoldchanges"]), strict=True))
[15]:
renderer: Renderer = Renderer(kegg_pathway=pathway, gene_dict=overlay, cache_or_resolver=resolver.storage)
renderer.render(display_unlabeled_genes=False)
[16]:
# Save dot string to file
with open(os.path.join(figure_dir, "figure5.dot"), "w") as file_obj:
    file_obj.write(renderer.to_string())

# Save binary data to file
renderer.to_file(filename=os.path.join(figure_dir, "figure5.png"), extension="png")
[17]:
# Display image
img: Image = Image(os.path.join(figure_dir, "figure5.png"))
display(img)
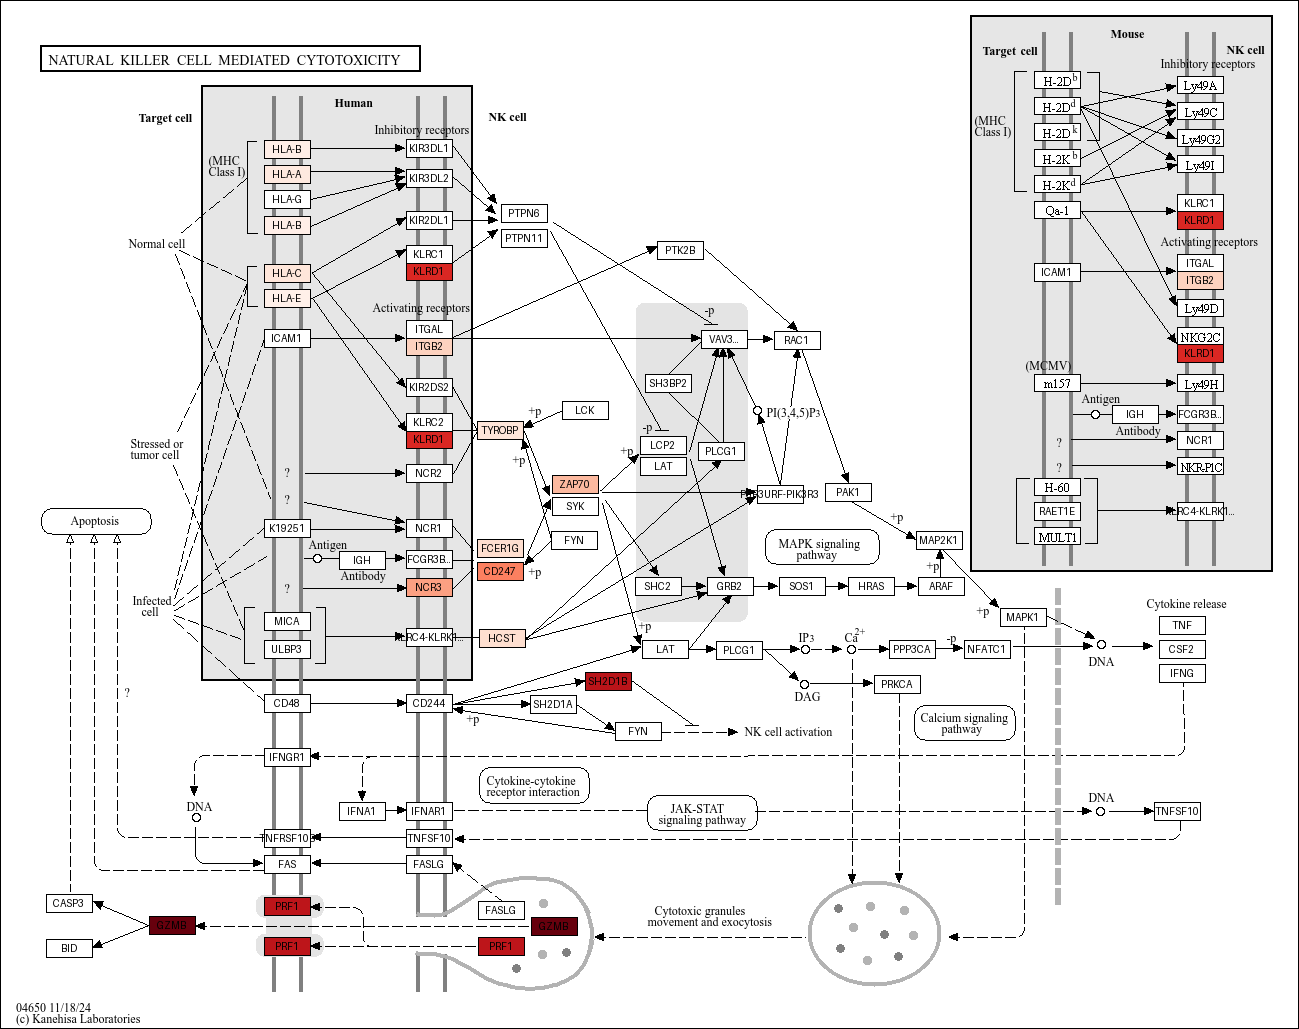
Plot with KEGG prerendered image#
[18]:
from keggtools import render_overlay_image

display(
    render_overlay_image(
        pathway=Resolver().get_pathway(organism="hsa", code="04650"),
        overlay_dict=overlay,
        cmap="Reds",
    )
)